.png?width=2048&height=1076&name=Design%20sans%20titre%20(8).png)

In about half of the cases we handle, the client cannot give us the performance curves of the vessel’s propeller. Yet the digital twin we build for each vessel depends on them to predict speed and fuel consumption. We have been working on a better way to estimate them by combining CFD and machine learning, a project led by Felix Wooldridge, naval performance engineer at Syroco, who presented it at CadenceCONNECT CFD Marine 2026 in Brussels.
What the propeller curve does in the digital twin
Propeller curves link the power and rotation speed of the engine to the thrust the propeller delivers, and so to the speed of the ship. If they are wrong, every prediction built on them inherits the error: fuel consumption, speed, and ultimately the recommendations sent to the bridge.
To use them, the twin runs a self-propulsion calculation in two steps. First, the hull is towed without its propeller, as if pulled by a rope, which gives the resistance of the hull alone. Then the propeller is put back, and the computation finds the thrust needed to hold the same speed.
If hull and propeller did not affect each other, that thrust would equal the resistance. They do, and the gap gives two interaction coefficients. The wake fraction accounts for the water the hull drags along, which reaches the propeller more slowly than the ship is moving. The thrust deduction factor accounts for the propeller drawing water from behind the hull and slightly increasing its resistance. Without them, the twin cannot predict the power the vessel actually needs, and both depend on a curve that reflects the real propeller.
The limits of the standard reference
So what do you use when the curves are missing? Our default has been the Wageningen B-series, a reference series built from towing tank tests. It is fast and reliable, but it describes a single, fixed family of propeller shapes. Compared with our in-house propeller database, it can be off by 5 to 10%, and the gap is widest on blades whose geometry departs most from that family.
Part one: making propeller CFD efficient enough to run at scale
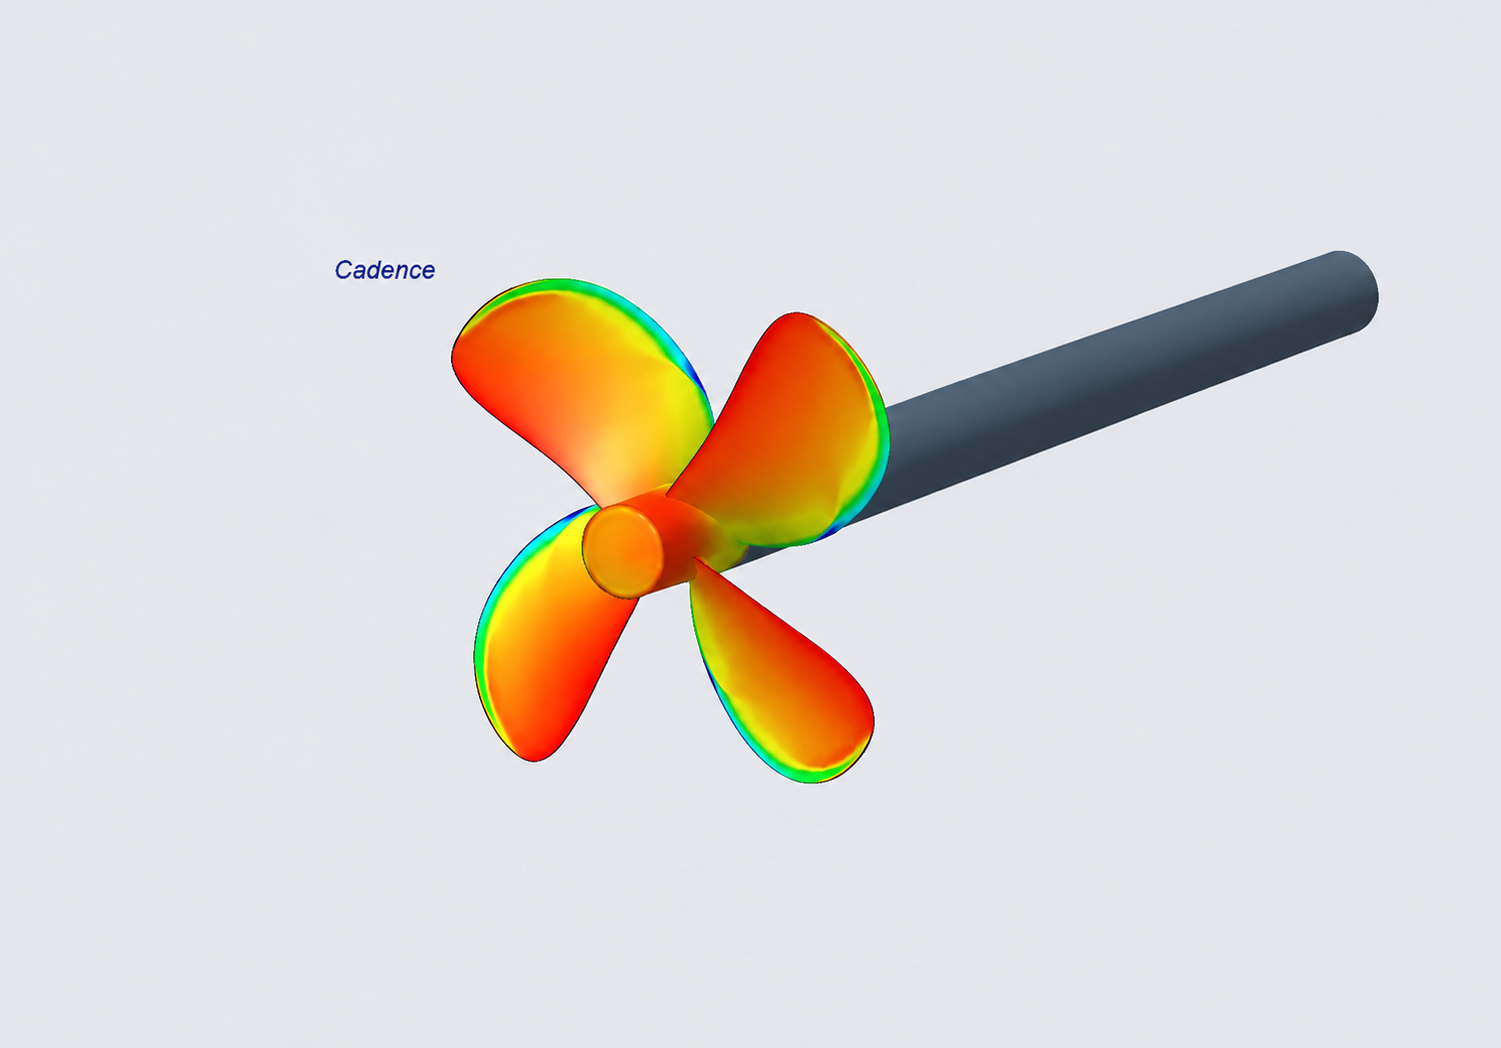
Simulating each propeller in CFD would remove the guesswork, but a full open-water campaign is expensive in computing time. We built a workflow that brings that cost down. It simulates a single blade instead of the whole propeller and keeps the mesh fixed by working in a rotating frame. It also builds the mesh from the blade surface outwards (Surface-to-Volume meshing), which captures the flow close to the blade more accurately than starting from a volume grid.


One computation now takes about 17 core-hours, against 53 to 99 for a full-propeller simulation. The workflow was checked for grid convergence and validated against a client’s reference curves.
Part two: teaching a model where the series goes wrong
Rather than learning propeller performance from scratch, we trained a machine learning model on a narrower question: for a given propeller, how far off is the B-series? The series still gives the overall shape of the curve. The model predicts the correction from five geometric features of the propeller, and returns the corrected curves with a confidence band that widens where it is less certain.
It was trained on 27 four-bladed propellers. Extra CFD cases were run where the model was least confident, which is exactly where the efficient workflow from part one pays off.
What the results show
Each propeller was tested after being left out of training. Compared with the B-series alone, the model reduced the average error by about 40% on thrust, 32% on torque and 25% on efficiency. The largest gains came where the B-series was furthest off. On propellers close to the B-series family, the model barely changes the curve, which is the intended behaviour.
We then fed a corrected curve into the digital twin of a real vessel, run in RPM mode, and compared the predicted shaft speed with the vessel’s sea trials. The average error dropped from 4.2 rpm with the B-series to 1.4 rpm, slightly better than the 1.5 rpm obtained with the client’s own reference curve. That propeller had been left out of training, so its curve was a genuine prediction.
This test has a clear scope: one vessel, nine sea-trial points, a narrow speed band. It illustrates the full pipeline. However, it does not validate it across a fleet.
Why it matters on the bridge
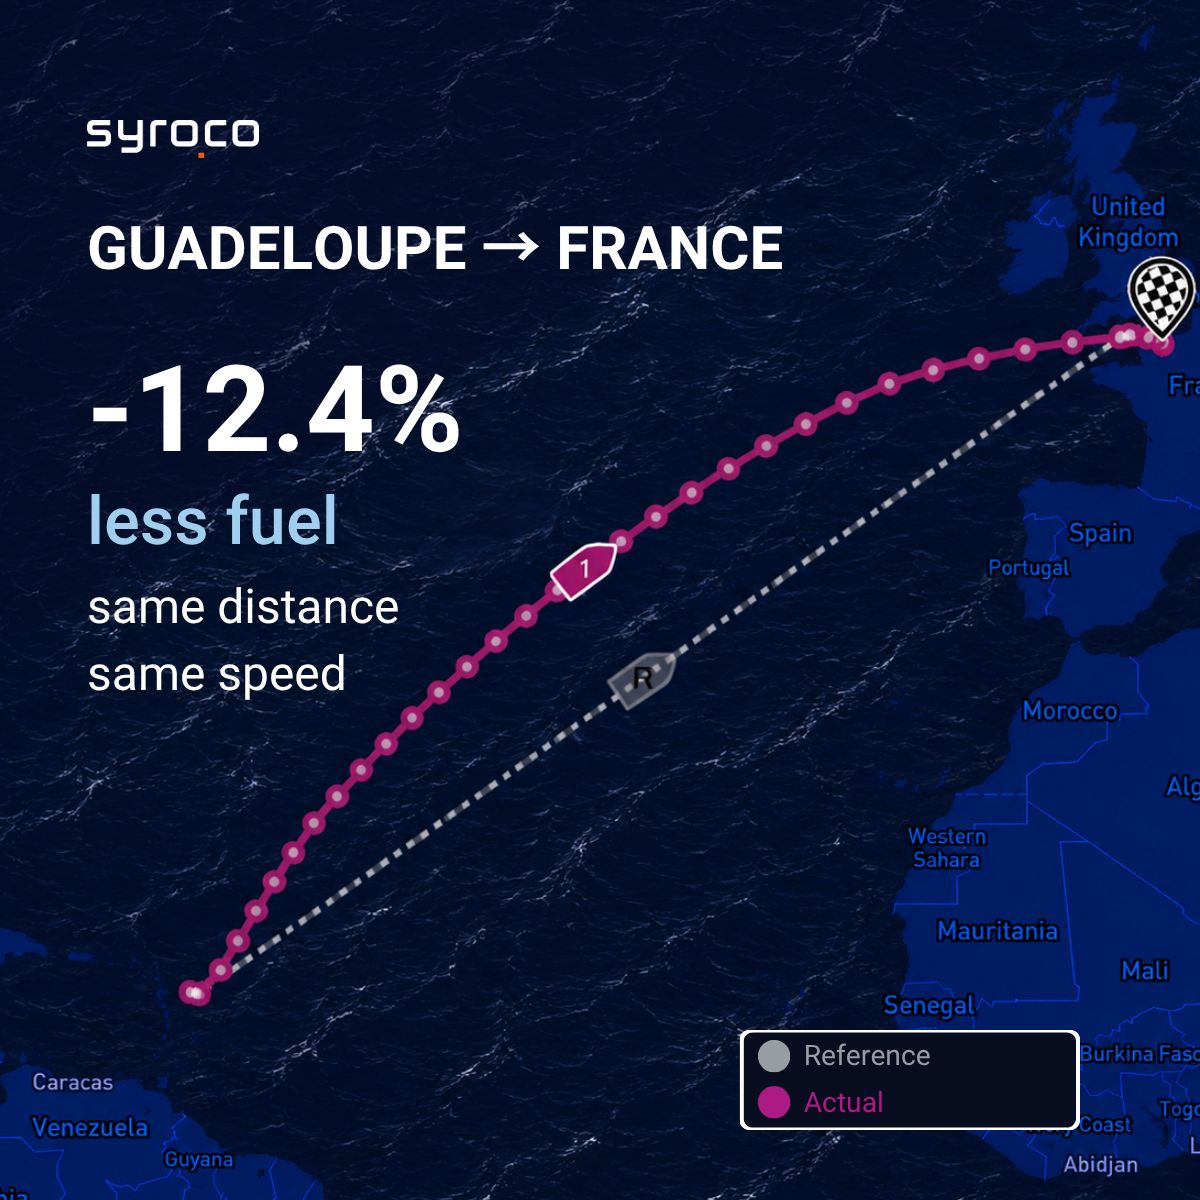
We offer captains three modes to follow a route: speed over ground (SOG), power, and engine speed (RPM). RPM is the most precise for routing, because it is the setting the captain adjusts directly, and we only offer it when the propeller curve is reliable enough.